
Azimuth & Elevation charts
. . . .
Azimuth & Elevations charts
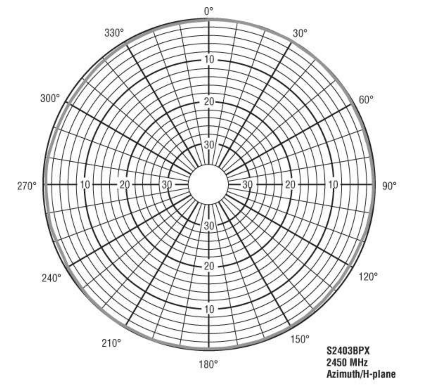
Azimuth chart - H-Plane
The azimuth chart, labeled H-plane, shows the top-down view of the radiation pattern of the antenna.
- In either chart, the antenna is placed at the center of the chart.
- Azimuth chart = H-plane = top-down view
- Elevation chart = E-plane = side view
Azimuth chart - H-Plane
The azimuth chart, labeled H-plane, shows the top-down view of the radiation pattern of the antenna.
H-Plane
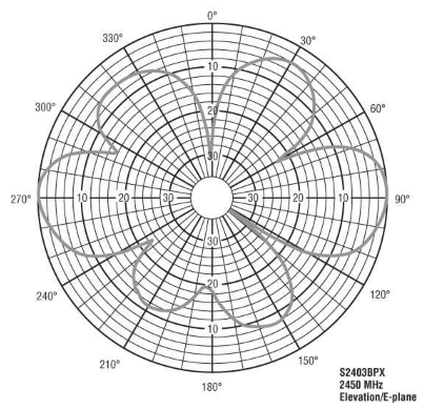
Elevation chart - E-Plane
The elevation chart, labeled E-plane, shows the side view of the radiation pattern of the antenna.
The elevation chart, labeled E-plane, shows the side view of the radiation pattern of the antenna.
Beamwidth on Polarization chart
- The outer ring of the chart usually represents the strongest signal of the antenna.
- The chart does not represent distance or any level of power or strength.
- It represents only the relationship of power between different points on the chart.
- With an antenna, the radiation pattern will grow larger or smaller depending on how much power the antenna receives, but the shape and the relationships represented by the patterns will always stay the same.
Rule of 6/10dB
- The rule of 6 dB, which indicates that a 6 dB decrease of power decreases the distance the signal travels by half.
- A 10 dB decrease of power decreases the distance the signal travels by approximately 70 percent.
Interpreting Polar charts
- Polar charts are often misinterpreted and misread.
- The biggest reasons these charts are misinterpreted is that they represent the decibel (dB) mapping of the antenna coverage.
- This dB mapping represents the radiation pattern of the antenna; however, it does this using a logarithmic scale instead of a linear scale.
- The left polar chart displays the logarithmic representation of the elevation chart of an omnidirectional antenna.
- The right polar chart displays the linear representation of the elevation chart of an omnidirectional antenna.
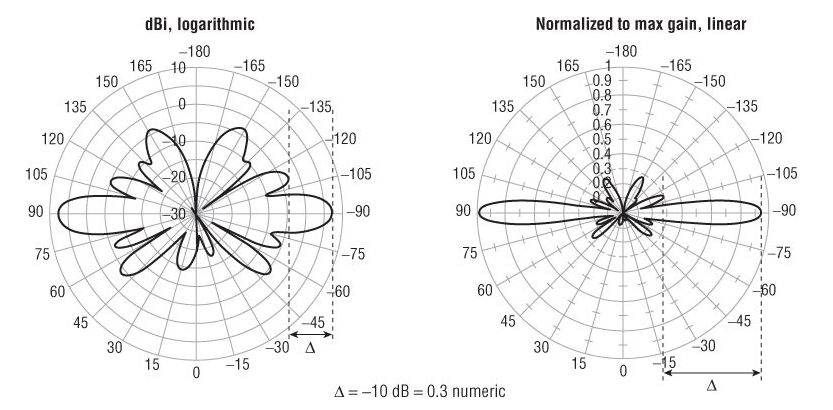
Logarithmic vs Linear
- When reading the logarithmic chart, you must remember that for every 10 dB decrease from the peak signal, the actual distance decreases by 70 percent. Each concentric circle on this logarithmic chart represents a change of 5 dB.
- This 10 dB decrease on the logarithmic chart is equal to a 70 percent decrease in range on the linear chart. Comparing both charts, you see that the side lobes on the logarithmic chart are essentially insignificant when adjusted to the linear chart. As you can see, this omnidirectional antenna has very little vertical coverage.
Reference:
Coleman, David D.,Westcott, David A. CWNA: Certified Wireless Network Administrator Official Study Guide: Exam CWNA-106 Wiley.
Coleman, David D.,Westcott, David A. CWNA: Certified Wireless Network Administrator Official Study Guide: Exam CWNA-106 Wiley.
|
|